Or how to blow up your app in 100 easy steps
Node.js has memory limitations that you can hit quite easily in production. You'll know this if you ever tried to load a large data file into your Node.js application.
But where exactly are the limits of memory in Node.js? In this short post we'll push Node.js to it's limits to figure out where those limits are. We'll also cover some practical techniques you can use to work around the memory limitations and get your data to fit into memory.
If you don't have time to read the post, please watch the video.
This post and video are based on my recent talk for BrisJS: The Brisbane JavaScript meetup. The slides for the talk are available online.
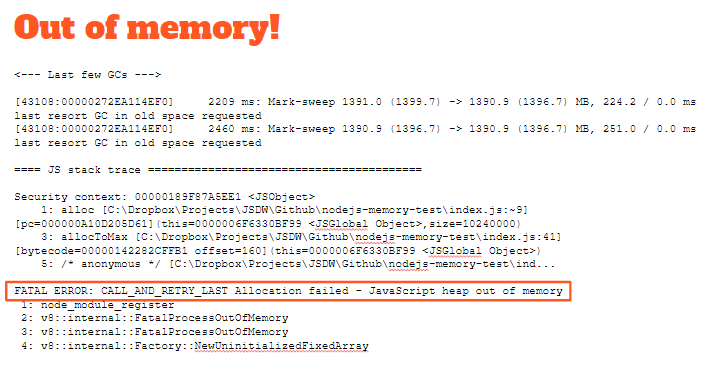
If you have ever run out of memory in Node.js you'll have known about it. You can't easily forget seeing a Node.js FATAL ERROR like that shown below.
Chapters 7 and 8 of my book Data Wrangling with JavaScript are all about how to squeeze a huge data set into memory without blowing up your application.

While writing chapters 7 and 8 I wondered
What is the limit of memory usage in Node.js?
Well, I could have simply searched online for this information - which I did anyway - but I also wanted to test the limits for myself. So I wrote some code to push Node.js to its limits. You'll see that in a moment and be able to try it for yourself.
First though let's understand
Why do we run out of memory in the first place?
It can happen when we load too much data at once. If you try and load a data set that is larger than available memory you will most certainly run out of memory - you'll get the FATAL ERROR we saw earlier.
The other big problem is the dreaded appearance of a memory leak. Your application might normally fit into memory, but when you have a bug that causes allocations to be retained your memory usage grows over time. In a long lived app this could take weeks or months, but eventually memory is exhausted and your app ceases to be.
In Node.js, we don’t have to explicitly free our allocations - the v8 garbage collector does that for us, but it’s not difficult to fool it into holding onto allocated memory.
Let's see some code
Here is some pseudo-code that will exhaust memory in Node.js. Please also check out the real memory testing code available on GitHub.
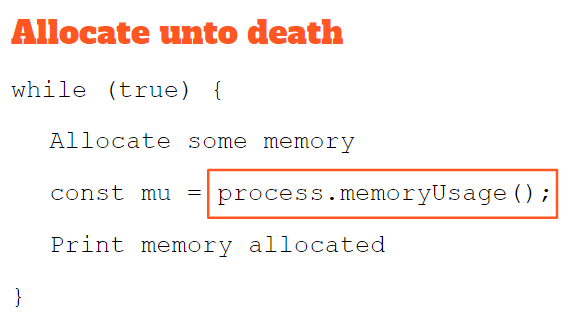
As you can see the code loops and allocates until Node.js breathes its last. The key here is the call to the function process.memoryUsage() that allows us to determine how much heap has been used.
Running the code produces output as shown below:
Allocated since start 1.26 GB
Allocated since start 1.27 GB
Allocated since start 1.28 GB
Allocated since start 1.29 GB
Allocated since start 1.3 GB
Allocated since start 1.31 GB
Allocated since start 1.32 GB
Allocated since start 1.33 GB
Allocated since start 1.34 GB
Allocated since start 1.35 GB
Allocated since start 1.35 GB
I have tested this code on my 8 GB Windows 10 laptop and it almost gets to 1.4 GB before the FATAL ERROR happens. I can fine tune the allocation step size and I get closer and closer to 1.4 GB (although the test takes longer and longer). I can't seem to push it beyond 1.4 GB. This appears to be a built-in default limitation in Node.js
So why the 1.4 GB limitation?
I honestly don't know. It seems very small, afterall a 64 bit app should theoretically be able to access 16 TB, which is a lot more than 1.4 GB!
My suspicion is the 1.4 GB limit is there for historical reasons. The V8 code orginally ran in a 32 bit browser with very strict and enforced memory restrictions (the JavaScript for each tab has to play with every other tab). Later Node.js was built on it and it was ported to 64 bit. I think the current limitation is a holdover from days gone by. If you know more about this please leave a comment below and enlighten me!
Node.js memory architecture
So memory is limited, but I do have a trick up my sleeve to raise the memory limit, but before that you need a quick overview of Node.js memory architecture to understand how the trick works.
The memory consumed by a Node.js application falls into one of three areas:
- Code
- Stack
- Heap
Code obviously is where your code is stored.
Stack is where the function call stack is stored. Local variables are allocated here.
Heap is what I'm talking about today: that's where dynamic allocations are stored. Here you find the strings, objects, and arrays that you work with in your JavaScript code.
The Node.js heap is composed of two sections:
- New space
- Old space
This is because allocations are divided into two generations.
New allocations happen in new space, also known as younger generation. This is a small amount of memory from 1 to 8 megabytes. It’s very fast to allocate and to reclaim space. Garbage collection here happens frequently.
Allocations that survive garbage collection in new space are promoted to old space or older generation. Old space is fast to allocate, but very slow to reclaim space. Garbage collection here is slow and happens infrequently.
So here's that trick I promised....
Let's just increase the amount of memory in old space
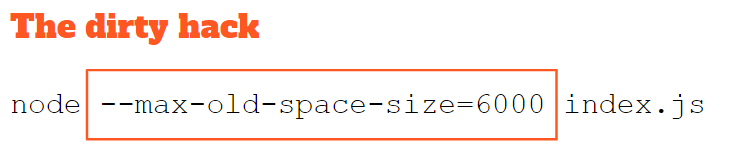
We can use the V8 engine parameter --max-old-space-size as shown below to raise the limit of heap memory that's available to us.
Now we have memory to burn!
I run the test code again with the parameter set to 6000 or 6 GB. You can see that I've now pushed it way beyond 1.4 GB and I'm closing in on 6 GB before the FATAL ERROR occurs:
Allocated since start 5.74 GB
Allocated since start 5.75 GB
Allocated since start 5.76 GB
Allocated since start 5.77 GB
Allocated since start 5.78 GB
Allocated since start 5.79 GB
Allocated since start 5.8 GB
Allocated since start 5.81 GB
Allocated since start 5.82 GB
Allocated since start 5.83 GB
Allocated since start 5.84 GB
Allocated since start 5.85 GB
How far can we go with this?
Theoretically in a 64 bit application we can access 16 TB of memory. Unfortunately I can't get anywhere near that and believe me I did try! I set the parameter to a very large number. The last allocation metric was 47 GB. At some point after that my laptop actually stopped responding and I had to force a reboot. Please don't try this at home kids! You might actually find a way to damage your PC.
Of course I'll never be able to allocate up to 16 TB, at least not on this laptop. My laptop only has 8 GB of physical memory. Once physical memory is exhausted an application's memory will be swapped out to hard disk via virtual memory.
So in effect I'm limited by the size of the laptop's hard drive. Even if I had 1 TB of disk space (which is pretty common now) I wouldn't even be able to allocate up to that amount. Of course the hard disk has files on it already and it must be shared amongst all the applications running on the laptop.
Fitting more in memory
Of course we shouldn't really be relying on a V8 engine parameter to make our production app fit into memory. That seems like a bit of risk! As far as Node.js is concerned that parameter appears to be undocumented and we all know that undocumented features can disappear without warning.
We are much safer to focus on fitting our application in memory without using the old space parameter.
But how do we ensure that our app fits safely in memory?
Well to start don’t ever load your entire data set into memory. Make sure you only ever load it in manageable chunks.
Then always be on the lookout for memory leaks. Make sure you manage and relinquish your references. If you retain references to your allocations the garbage collector can’t do it’s job.
You should also monitor your production memory usage. This isn't difficult. Routinely call the aforementioned function process.memoryUsage(), log the heapUsed metric and render it to a chart (feel free to use my open-source library Data-Forge Plot. You can then easily see if there is an uptrend over time.
Lastly if all else fails, you might need to start decomposing your monolithic app into separate processes. I’m talking about microservices.
This is good for scalability:
- Each process can potentially run on a separate CPU.
- Each process has its own separate memory space.
Microservices are going to make your architecture more complicated, but if your application is already heading into complicated territory you'll probably find that microservices at least allows each of the component of the system to be simplified, even when the system as a whole is very complex.
To learn more, please see chapter 7 and 8 of my book Data Wrangling with JavaScript. I have a lot more to say on this topic of getting your app to fit in memory. You can also learn about how to analyse and chart your app's metrics, such as memory usage.
One last tip... just remember that your application doesn't have to run forever! It simply has to run for the duration of your continous delivery cycle. That gives you some kind of rough guideline for your soak testing. If you deploy ever two weeks, make sure your application can run for two weeks under load without problem!
Resources
- Memory test code on GitHub
- Video of the talk
- Slides for the talk
- process.memoryUsage
- Data Wrangling with JavaScript
Interesting articles
https://blog.codeship.com/understanding-garbage-collection-in-node-js/
http://jayconrod.com/posts/55/a-tour-of-v8-garbage-collection
https://blog.risingstack.com/finding-a-memory-leak-in-node-js/